


Animals
Wild-type C57BL/6J mice were purchased from Vital River company (China) and housed in groups, in the animal facility at Shanghai Sixth People’s Hospital, Shanghai Jiaotong University. Asic1a−/− (with congenic C57BL/6J background) mice were provided by the T.-L. Xu laboratory. All mice were kept in standard cages (15 cm × 21 cm × 13.5 cm) under a 12 h–12 h light–dark cycle with ad libitum access to food, water and nesting material. The mice were checked daily and their weight was monitored during the experiments. Mice were randomly allocated to treatment groups.
Ethical approval
Throughout the study, all efforts were carried out to minimize animal suffering and reduce the number of animals. Experiments were conducted in conformity with the institutional guidelines for the care and use of animals, and experimental protocols that were approved by the Ethics Committee of Shanghai Sixth People’s Hospital.
Electrophysiology analysis of cultures
Whole-cell recordings
Whole-cell patch clamp recordings were taken from either neurons or CHO cells in a recording chamber (Corning) mounted onto a fixed-stage upright microscope (Nikon). Patch electrodes (4–6 MΩ) were made from 1.5 mm borosilicate glass (World Precision Instruments). Whole-cell currents were recorded using an EPC-10 patch-clamp amplifier (HEKA). Data were acquired at 10–20 kHz and filtered at 1–3 kHz using a computer equipped with the Pulse 6.0 software (HEKA, Lambrecht). Cells were recorded at a holding potential of −60 mV unless otherwise described. For NMDAR current recordings, the holding potential was −70 mV. A multi-barrel perfusion system (SF-77B, Warner Instruments) and pressure regulator system (ALA-VM8, Scientific Instrument) were used to achieve a rapid exchange of extracellular solutions. The perfusion protocol was set and controlled by the PatchMaster software. To avoid use-dependent desensitization or rundown, ASICs were repeatedly activated by acidic solution at minimal interpulse intervals of >1 min. During each experiment, a voltage step of −10 mV from the holding potential was applied periodically to monitor the cell capacitance and access resistance.
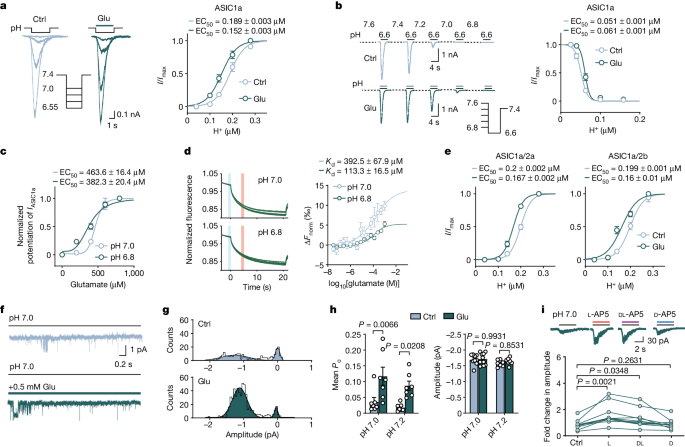
Dose–response curves were fitted to the Hill equation: \(a=I/{I}_{\max }\,=\)\(1/[1+{10}^{n(b-{{\rm{EC}}}_{50})}]\), where a is the normalized amplitude of the IASICs, b is the concentration of proton in external solution ([H+]), EC50 is the proton concentration or [H+] yielding half of the maximal peak current amplitude and n is the Hill coefficient. The IC50 values for blocker dose–response curves were fitted using the following equation: \(I/{I}_{\max }=1/\left\{1+{\left[{{\rm{IC}}}_{50}/({\rm{blocker\; concentration}})\right]}^{n}\right\}\), where n is the Hill coefficient and IC50 is the concentration of blocker producing 50% of the maximal block (Imax).
Single-channel recordings
Unitary currents were recorded using the outside-out configuration of the patch-clamp technique in ASIC1a transfected CHO cells. Channels were activated by rapidly moving squared-glass tubes delivering solutions of desired pH in front of the tip of the patch pipette. The delivery device achieves complete solution changes within 20 ms (SF-77B). When filled with solutions, pipettes had resistances of 6–10 MΩ. Single-channel currents were recorded using the EPC-10 patch-clamp amplifier (HEKA). The data were collected at 10 kHz and gain value 200 mV pA−1, filtered at 1 kHz, and stored on a computer for analysis. Data were filtered off-line with a digital Gaussian filter to 1 kHz. All points amplitude histograms of ASIC unitary currents are fitted to the two-exponential equation:
$$a={\rm{A1}}\times \exp \{-0.5\times {[(b-{\rm{M1}})/{\rm{SD}}1]}^{2}\}+{\rm{A2}}\times \exp \{-0.5\times {[(b-{\rm{M2}})/{\rm{SD}}2]}^{2}\}$$
where a is the count of ASIC unitary currents, b is the amplitude of ASIC unitary currents. A1 and A2 are the heights of the centre of the distribution, and M1 and M2 are the amplitude of ASIC unitary currents at the centre of the two distributions. SD1 and SD2 are measures of the widths of the distributions, in the same units as b (pA).
Solutions and chemicals
The artificial cerebrospinal fluid (aCSF) contained 124 mM NaCl, 5 mM KCl, 1.2 mM KH2PO4, 1.3 mM MgCl2, 2.4 mM CaCl2, 24 mM NaHCO3 and 10 mM glucose, with pH 7.4 (300–330 mOsm). The ECF for culture cells or neurons contained 140 mM NaCl, 5 mM KCl, 1 mM CaCl2, 1 mM MgCl2, 10 mM glucose and 25 mM HEPES. For solutions with pH ≤ 6.8, MES was used instead of HEPES for stronger pH buffering. For NMDAR current recordings, MgCl2 was removed. The intracellular solution for voltage-clamp recordings contained 130 mM K-gluconate, 2 mM MgCl2, 1 mM CaCl2, 10 mM HEPES, 0.5 mM EGTA, 4 mM Mg-ATP, with pH 7.3, and the osmolality was adjusted to 290–300 mOsm. For isolated neuron and NMDAR current recordings, K-gluconate was replaced by CsCl. All experiments were performed at room temperature (21–26 °C).
d-AP5, CGS19755, amiloride and PcTX-1 were purchased from Alomone Labs; l-AP5 and CGP39551 were purchased from Tocris; NBQX, LY341495, CGP37157 and RO2959 were purchased from MedChemExpress; and other chemicals were purchased from Sigma-Aldrich or Macklin. Note that the pH of all ECF in this study with any chemicals added was adjusted to the indicated values (the pH changes less than 0.02 after adding chemicals).
Cell culture and transfection
Chinese hamster ovary (CHO) K1 and HEK293T cells (provided by Stem Cell Bank, Chinese Academy of Sciences) were cultured in F12 and DMEM medium with 10% FBS (Gibco), respectively. Penicillin–streptomycin (Invitrogen) was added to the medium for preventing bacteria contamination at a final concentration of 1%. For NMDAR expression, 500 μM d-AP5 was added in the cultured medium to avoid glutamate-induced toxicity through activating NMDAR50. 0.25% Trypsin-EDTA (Gibco) was used for cell passage. Cells were incubated at 37 °C in a humidified CO2 incubator. Cells were transfected with plasmids described in detail previously51. In brief, at a cell density of 50–70%, a total 3.0 μg cDNA mixed with the Lipofectamine 3000 transfection kit (Invitrogen) was added to 35 mm dishes. For co-expression of ASIC1a plus 2a or 2b, equal amounts of cDNA for both subunits were used. For NMDAR expression, plasmids of GluN1, GluNR2A or GluNR2B and PSD-95 at a ratio of 1:4:0.5 were used. cDNA of green fluorescent protein (GFP) was linked at the N terminus of those proteins. All experiments were performed 24–48 h after transfection, all dishes were washed three times using ECF before experiments, and GFP-positive CHO cells were viewed under a fluorescence microscope for patch-clamp recordings. Human and mouse ASIC subunits were used for constructing all wild types and mutants in this study.
Primary cortical neuron culture
Primary cortical neurons were prepared and maintained as previously described52. In brief, cerebral cortices from 24 h postnatal Asic1a+/+ or Asic1a−/− mice were dissected in DMEM high-glucose solution and dissociated by 0.05% trypsin for 15 min. Cells were plated (~2 × 10⁵ cells per 35 mm dish for electrophysiology and cell death experiments) on Matrigel-coated (Corning) cover glasses or dishes. Cultures were maintained in Neurobasal-A medium (Gibco) containing 2% B27 (Gibco) and 1% GlutaMax supplements (Gibco) at 37 °C under a 5% CO2 humidified atmosphere.
Acute isolation of cortical neurons
Acute dissociation of mouse cortical neurons was performed as described previously53. In brief, mice from postnatal day 15 to 18 were anaesthetized with isoflurane. Cortical tissues were dissected and incubated in oxygenated ice-cold aCSF (with half concentration of CaCl2). Transverse cortical slices (500 µm) were cut with a microtome (Leica VT1200) followed by incubation in aCSF containing 3.5 mg ml−1 papain (Sigma-Aldrich) at 37 °C for 30 min. The slices were then washed three times and incubated in enzyme-free ECF solution for at least 15 min before mechanical dissociation. For dissociation, slices were triturated using a series of fire-polished Pasteur pipettes with decreasing tip diameters. Recording began 15 min after the mechanical dissociation. Only the neurons that retained their pyramidal shape and dendrites were used for recordings.
Site-directed mutagenesis
All ASIC1a mutants were obtained through PCR mutagenesis using wild-type Asic1a gene, inserted into the pEGFPC3 vector (Clontech) using the Seamless Cloning kit (Sunbio). For single-site mutations, the PCR (50 μl) reaction contained 1 μl DNA template, 2 μl primer pair, 4 μl dNTPs and 0.5 μl of high-fidelity DNA polymerase (PrimeSTAR, Takara). The PCR cycles were initiated at 98 °C for 3 min, followed by 30 amplifications (98 °C for 10 s, 55 °C for 15 s and 72 °C for 1 min). The last step was performed at 72 °C for 10 min. Each mutant cDNA was transformed into Escherichia coli chemically competent cells. All mutants were sequenced by PCR sequence analysis to confirm the presence of the desired mutation and the absence of undesired mutations.
Ca2+ imaging
Primary cortical neurons were incubated in a confocal microscopy (Zeiss 710) specialized dish (35 × 35 mm, Cellvis) with ECF (saturated with 95% O2) and 1 μM fluo-3 AM (Beyotime) for 20 min at room temperature, followed by three washes and additional incubation in normal ECF for 15 min. The dish was then transferred onto the stage of the confocal microscope. Neurons were illuminated using a xenon lamp and observed with a ×40 UV fluor objective lens. The shutter and filter wheel were set to allow for 488 nm excitation wavelength. Images were analysed every 5 s in circumscribed regions of cells in the field of view. Digital images were acquired, stored and analysed by the ZEN software (Zeiss). For quantification, intracellular calcium levels were plotted as ΔF/F0 ratios over time, where F0 is the initial fluorescence intensity of each cell.
Imaging of mitochondrial membrane potential
The mitochondrial membrane potential (Ψm) was measured using JC-1 (Beyotime). Primary cortical neurons were loaded with JC-1 working solution in for 20 min, then washed and incubated in JC-1 wash buffer for 5 min before recording. JC-1 was imaged with 488 nm and 546 nm excitation wavelengths using a 40× objective. For quantification, the Ψm was measured as the fluorescence intensity ratio of red and green (R/G), then the ratio was normalized to the initial fluorescence intensity ratio of each cell.
OGD analysis
Cultured neurons were washed three times and incubated with glucose-free ECF (glucose was replaced by an equal concentration of sucrose) at pH 7.4 or 7.0 in an anaerobic chamber with an atmosphere of 95% N2 and 5% CO2 at 35 °C (controlled by an OxyCycler oxygen profile, BioSpherix). OGD was terminated after 1 h by replacing the glucose-free ECF with normal ECF.
Calcein–propidium iodide cell death assay
For cultured neurons, the calcein–propidium iodide cell death assay was performed after 1 h OGD and neurons were exposed to 1 μM calcein-AM and 2 μM propidium iodide (Solarbio) for 15 min (ECF was saturated with 95% O2 and 5% CO2). For ASIC1a–GFP-transfected CHO cells, the assay was performed after 1 h different treatments and the cells were exposed only to 2 μM propidium iodide for 15 min. All cells were then washed three times with ECF. After fixation in 4% paraformaldehyde (Solarbio) for 30 min, images were acquired shortly after staining by confocal microscopy. The live cells and apoptotic nuclei were determined by 488 nm and 546 nm excitation wavelengths using microscopy examination at ×40 magnification. The number of staining nuclei was counted using the Image J software. The percentage of cell death was calculated as: cd% = [nred/(nred + ngreen)] × 100, where cd% is the percentage of cell death, nred and ngreen are the number of PI-stained (dead cells) and calcein-stained (live cells) cells or GFP-labelled cells, respectively.
Cell injury assay with LDH measurement
LDH release for cultured neurons was measured after 1 h OGD using the LDH assay kit (Beyotime). After incubation, culture medium (60 μl) was transferred to 96-well plates and mixed with 30 μl reaction solution provided by the kit for 30 min (37 °C). The optical density was measured at 490 nm and the background absorbance was subtracted at 620 nm, using a microplate photometer (Multiskan MK3, Thermo Fisher Scientific). The maximal releasable LDH in each group was obtained by incubation with 1% Triton X-100 for 30 min.
Glutamate-release assay
Glutamate production was measured using the Glutamate Assay Kit (Sigma-Aldrich, MAK004). In brief, the supernatants of cultured neurons were deproteinized with a 10 kDa MWCO spin filter before addition to the reaction. Glutamate standard was prepared by diluting 0.1 M glutamate (provided in the kit) to a different concentration gradient. The glutamate standard and each sample were added into a 96-well plate (50 μl per well), and 100 μl reaction solution was added to each well and mixed thoroughly. The mixture was incubated at 37 °C for 60 min. The absorbance of each well was measured on a microplate reader using 450 nm as the primary wavelength. The glutamate concentration of each sample was calculated by glutamate standard curve.
MCAO
Transient focal ischaemia was induced by suture occlusion of the MCAO in Asic1a+/+ and Asic1a−/− mice (the same number of male and female mice beyond 6 weeks was used). Animals were anaesthetized using an animal mini anaesthesia machine (RWD). During anaesthesia induction, the mice were put into a chamber (15 cm × 25 cm × 30 cm) with 2% isoflurane; the mice were put on a mask with 1% isoflurane during MCAO operation. Adequate ischaemia was confirmed by continuous laser Doppler flowmetry (moor FLPI-2). Mice that did not have a significant decrease in blood flow to less than 50% baseline values during MCAO were excluded. Rectal and temporalis muscle temperature was maintained at 33 ± 0.5 °C with a thermostatically controlled heating pad (Supplementary Table 6). Intraperitoneal injection was performed immediately after removing the suture occlusion. Mice were killed with isoflurane overdose 24 h after ischaemia.
Brains were removed and dissected coronally at 1 mm intervals, and stained with the vital dye TTC and the normal area was stained with TTC. Infarct volume (%) was calculated by summing infarction areas of all sections and multiplying by slice thickness, then dividing the whole volume of the brain. Manipulations and analyses were performed by individuals blinded to treatment groups. Depending on the experimental design, 30 min MCAO was performed for moderate ischaemic model.
Laser speckle imaging
Mice were anaesthetized by 1% isoflurane and their head was restrained in a stereotaxic cylinder frame to minimize breathing motion. The scalp and the skull fascia were gently incised down the midline and peeled to the side. Saline was titrated onto the skull to keep it moist. Laser speckle images were recorded using a CMOS camera before MCAO, 15 min after occlusion and 15 min after reperfusion. For each animal, three sets of raw speckle images were acquired in <15 s (250 frames in each set; image width, 752 pixels; image height, 580 pixels; exposure time, 20 ms). A speckle contrast image was calculated from each raw speckle image using a sliding grid of 2.5 mm × 2.5 mm. A mean speckle contrast image was calculated for each set and used to calculate the rCBF. The rCBF in the ipsilateral (ischaemic) hemisphere was normalized to the mean rCBF in the contralateral (non-ischaemic) hemisphere. Speckle images were obtained and processed using mFLPI2Meas (v.2.0), rCBF data from all pooled hemispheres were obtained using moorFLPIReview (v.50). All analyses were randomized.
Molecular docking and Prime-MM/GBSA binding free-energy calculation
The structures of cASIC1a (PDB ID: 5WKU; resting state) and NMDAR (PDB: 5IOU) were obtained from the PDB. Structures of chemicals (that is, l-glutamate, AP5) were obtained from the PubChem compound or ChemBioDraw Ultra 14 software. Initial docking studies involved preparation of the cASIC1a and glutamate using the High-Ambiguity Driven protein-protein DOCKing (HADDOCK) software. The entire accessible extracellular surface area of the protein was considered as a plausible interface with glutamate. After docking calculations, the highest scoring docking poses were analysed. The results revealed several plausible glutamate-binding sites (Supplementary Table 2), which were subsequently validated by site-directed mutagenesis.
After identification of a most probable binding site, additional docking poses were generated using the Schrödinger Maestro software suite (Schrödinger, 2020-3). Before docking, protein was processed using the Protein Preparation Wizard to add missing residues, optimize side-chain positioning, remove bound waters, optimize H bonds and minimize energy (using OPLS3e force field). Ligands were optimized using the OPLS3e force field in LigPrep module. Protein and ligand protonation states at pH 7.0 ± 0.2 were sampled using Epik.
Ligands were docked to an identified residue (for example, Lys379) in a grid box with dimensions of 25 × 25 × 25 Å3. Extra-precision docking (Glide XP) was performed with flexible ligand sampling, and post-docking minimization was performed to generate a maximum of ten poses per ligand within the Glide program. The docking conformation with a highest docking score was further analysed. The binding free energies of all different poses from XP docking outputs were carried out using the Prime-MM/GBSA module29. The binding energy proxy was calculated by the software according to the following equation:
$$\Delta G={E}_{{\rm{complex}}\left({\rm{minimized}}\right)}-\left[{E}_{{\rm{ligand}}\left({\rm{minimized}}\right)}+{E}_{{\rm{receptor}}\left({\rm{minimized}}\right)}\right]$$
Molecular dynamics simulations
For molecular dynamics simulation, the pose with highest docking score of each ligand–protein complex was selected from docking results and the ligand-bound protein systems were built in 150 mM NaCl aqueous solution. To investigate the stability of the docked ligand–protein poses, 50 ns simulations were performed. After 25,000 steps of minimization, the systems were equilibrated using isothermal-isobaric (NPT) ensembles at a constant temperature of 303.15 K, followed by 50 ns production runs. All simulations used the program GROMACS 2020.3. CHARMM36m force field was used for the protein, GROMOS 54A7 force field for ligand54 and the SPCE model for water. The simulation trajectories were analysed for structural fluctuations using root-mean-square deviation and root-mean-square fluctuation calculations. MM-PBSA calculations on molecular dynamics simulation trajectories were performed with a modified gmx_mmpbsa bash script using solvent-accessible surface area as the model for non-polar solvation energy.
CGS19755-binding pocket analysis and drug design
The pose with the highest docking score of the CGS19755–cASIC1a complex was selected from molecular docking for binding pocket analysis using Fpocket 2.0 software. A dpocket program analysis was performed to produce pocket parameters using the default settings. We used a scaffold-replacement method based on the CGS19755 structure to screen the ZINC20 database (fragment, lead-like and drug-like molecules) using the Molecular Operating Environment software (v.2015.10). The three-dimensional conformations of the remaining about 222 compounds were generated by the ligPrep module of Maestro (Schrödinger) with the OPLS3e force field. Possible ionization states of each compound were generated in the pH range of 7.0 ± 0.2 using Ionizer. Possible tautomer forms were also generated for each ligand. Compounds were screened using the high-throughput virtual screening module followed by the extra-precision docking module in Glide. The Glide docking score was used to rank the results list. Finally, six hits were selected for the electrophysiological assay.
MST assay for protein- and compound-binding assays
The MST measurement for the binding of compounds to ASIC1a was performed using Monolith NT.115 (NanoTemper)16. In brief, the HEK293T cell was collected after 48 h transfection with eGFP-tagged wild-type or mutant ASIC1a plasmid and lysed by M-PER mammalian protein extraction reagent (Thermo Fisher Scientific). Protease/phosphatase inhibitor (1%, Cell Signaling) was added to the lysate to avoid protein degradation. The level of ASIC1a was verified by measuring the total fluorescence. For binding studies, the lysate was diluted fourfold using ECF (with 0.1% Tween-20) to provide the optimal level of the fluorescent protein in the binding reaction. Compounds were titrated by ECF at a 1:1 ratio, diluted 16 times. Subsequently, 5 μl cell lysate was mixed with 5 μl compounds at different concentrations. After 5 min incubation at room temperature, all of the samples were loaded into MST NT.115 standard glass capillaries and measurement was performed at 70–100% excitation power to control the fluorescence value between 300 and 400 using the MO control software (v.1.6.1). The thermophoresis time (t) was 23 s, and the experimental temperature (T) was 25 °C. At least three independent experiments were repeated and then the data were imported into MO affinity analysis software (v.2.3) of NanoTemper was used to calculate the Kd value using the Kd model. The cold and hot fluorescence were measured at −1–0 s and 4–5 s to avoid thermally induced protein configuration change, respectively. The ECF pH was 7.0 unless otherwise described.
Chemical synthesis
LK-1, LK-2 and other screened compounds were custom synthesized by Simcere Pharmaceutical for this study (Supplementary information). For electrophysiology, stock solutions of two compounds were prepared in water and diluted in the ECF solutions before use for in vitro experiments or in saline for animal studies in vivo.
Pharmacokinetics study
Pharmacokinetics of LK-2 was analysed in male C57BL/6J mice (n = 22). Plasma and brain concentrations were determined using LC–MS/MS methods after a single intraperitoneal injection dose (30 mg per kg) of compound as a clear solution in 0.9% saline at a concentration of 1 mg ml−1. Blood samples were collected into an EDTA-coated test tube at the time points of 0.083 h, 0.25 h, 0.5 h, 1.0 h, 2.0 h and 4.0 h, and then centrifuged at 2,000g for 15 min to generate plasma samples. Brain samples were collected after intraventricle perfusion with normal saline and prepared by homogenizing tissue with 5 volumes (w:v) of 0.9% NaCl. LC–MS/MS methods to quantify LK-2 in plasma and brain samples were developed with the LC-MS/MS-T API 4000 instrument. General sample processing procedure was performed as follows: (1) an aliquot of 30 µl plasma sample, calibration standard, quality control, single blank and double blank sample was added to the 1.5 ml tube. An aliquot of 40 µl brain homogenate, calibration standard, quality control, single blank and double blank sample was added to the 96-well plate respectively. (2) Each sample (except the double blank) was quenched with 150 µl (for plasma samples) or 200 µl (for brain homogenates) of IS 1 (6 in 1 internal standard in methanol (labetalol, tolbutamid verapamil, dexamethasone, glyburide and celecoxib, 100 ng ml−1 for each) with 40 mM DBAA) (the double blank sample was quenched in methanol with 40 mM DBAA), and the mixture was then vortex-mixed well (at least 15 s) and centrifuged for 15 min at 12,000g (for plasma samples) or 3,220g (for brain homogenates) at 4 °C. (3) An aliquot of 65 µl supernatant was transferred to the 96-well plate and centrifuged for 5 min at 3,220g at 4 °C. All of the processes were performed on the wet ice. All of the supernatants were directly injected for LC–MS/MS analysis. The column used was an ACQUITY UPLC BEH C18 2.1 × 100 mm, 1.7 μm column. The column temperature was 40 °C. The flow rate was 0.4 ml min−1. The mobile phase consisted of A: 0.001% NH3·H2O with 0.18 mM DBAA in water; and B: 10 mM DMHA and 3 mM NH4OAc in ACN/Water (v:v, 50:50). Standard curves were prepared by spiking compounds into control plasma and brain and these were used to determine drug concentrations. Pharmacokinetic parameters were calculated by non-compartmental analysis using DAS v.2.0 with the mean concentration at each timepoint.
Rotarod test
Motor behaviours were tested using the rotarod test (RWD). The rotarod measures the ability of mice to maintain balance on a motor pressure-driven rotating rod. In this test, mice were put on a rotating rod, and the time to fall off was recorded. Mice were trained five times to learn moving on the rod before testing, in which the speed was accelerated from 4 to 40 rpm in 3 min. The rod was cleaned with alcohol before each test.
Statistics
All data are reported as mean ± s.e.m. The number of biological replicates has been reported as nested data. Two-tailed paired and unpaired Student’s t-tests were used where appropriate to examine the statistical significance of the difference between groups of data. Comparisons among multiple groups were analysed using one-way and two-way ANOVA followed by Tukey multiple-comparison tests for post hoc analysis. Prism 8 was used to analyse all data.
Reporting summary
Further information on research design is available in the Nature Portfolio Reporting Summary linked to this article.


